Finance Teams Test Dashboards vs AI Reporting
The Zebra BI blog documents a live comparison of governed dashboards and AI-driven reporting on the same data model, run against the financials of 100 public companies across 6 industries and 6 years, per the Zebra BI post. In the demo, a Power BI-based P&L was rebuilt in the standard IBCS format while an AI agent read the identical data model, generated an executive-ready P&L and produced written narrative in seconds. The Zebra BI writeup reports the AI also computed EBITDA margins not present in the raw data, generated industry ranking and added an unsolicited competitor comparison. Participants are quoted: "This is all live. This is not a marketing video," and "It's so fast, I can't even read it." The blog's core recommendation is to keep governed dashboards for repeatable, board-level numbers and use AI for self-service and ad hoc questions, both fed from a single clean data model.
What happened
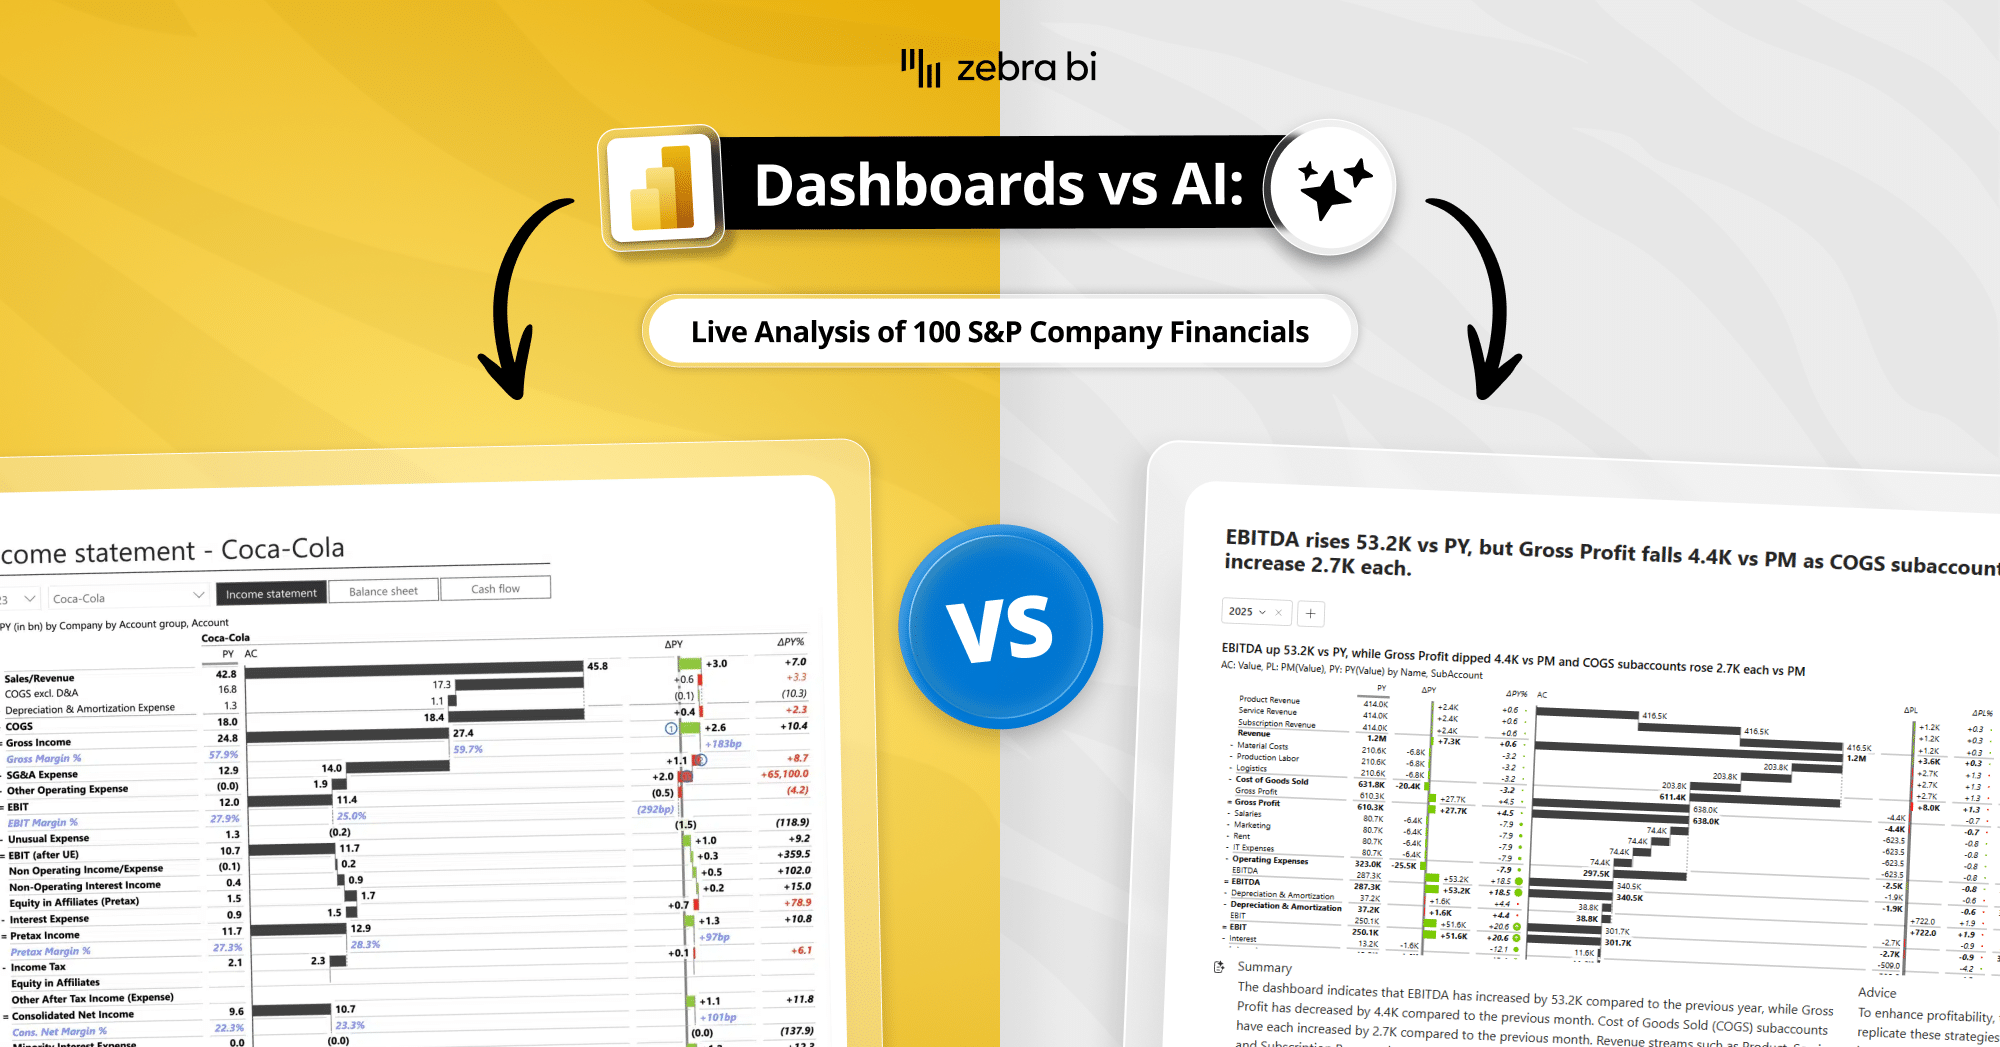
Per a Zebra BI blog post, the team ran a live, unscripted comparison of governed dashboards and an AI-driven reporting flow on the same underlying model, using the financials of 100 public companies spanning 6 industries and 6 years. In the room, a finance analyst rebuilt a Profit & Loss in Power BI using a standard IBCS structure. The Zebra BI account says an AI agent was pointed at the same data model, produced an executive-ready P&L, and wrote the accompanying narrative in seconds. The blog reports the AI also calculated EBITDA margins that were not present in the source tables, produced an industry ranking and inserted an unsolicited competitor comparison. Direct quotes in the post include: "This is all live. This is not a marketing video," and "It's so fast, I can't even read it." The post frames the practical conclusion as: keep governed dashboards for repeatable, board-level reporting, and use AI for self-service and ad hoc queries, with both fed from one clean model.
Editorial analysis - technical context
Companies comparing dashboarded reporting and AI assistants often face a tradeoff between repeatability and exploratory flexibility. Dashboards provide governed, auditable views that enforce structure across recurring artifacts such as the monthly close or board pack. Conversely, AI-driven interfaces excel at natural-language queries, narrative generation, and rapid ad hoc slicing of the same data. Industry-pattern observations: combining both approaches on a single canonical data model reduces duplication, preserves governance, and lets analysts shift time from formatting to interpretation without losing consistent numbers.
Context and significance
For finance practitioners, the Zebra BI demo illustrates how AI can accelerate narrative and exploratory work while dashboards retain deterministic numbers for formal reporting. The reported behavior where an AI generates derived metrics and unsolicited comparisons underscores the need to log derivations and surface provenance when AI augments financial outputs. Observed patterns in similar deployments show teams prioritize lineage, validation rules, and guardrails when AI-generated outputs feed decision processes.
What to watch
Track how teams implement provenance and explainability for AI-derived figures, whether through automated audit trails, transparent formula mapping, or approval workflows. Observers should also watch adoption patterns around which report classes remain dashboard-only versus those shifted to AI-powered self-service. Zebra BI has published the demo and a webinar linked from the post for practitioners who want to reproduce the experiment on their own P&Ls.
Key Points
- 1Live demo on 100 public companies shows AI can generate P&Ls and narratives seconds faster than manual reporting, enabling rapid ad hoc analysis.
- 2Governed dashboards remain the reliable source for repeatable board-level numbers; AI suits self-service and exploratory queries on the same data model.
- 3Industry deployments typically combine a single canonical data model with audit trails to preserve governance while enabling AI-driven narratives.
Scoring Rationale
A vendor-originated demo comparing governed dashboards to AI-driven reporting on real public-company financials. Useful operational framing for finance practitioners, but the primary source is a Zebra BI webinar page rather than independent journalism or research, and no third-party validation of the demo results is available. Solid niche relevance warrants mid-range score.
Sources
Primary source and supporting public references used for this report.
Practice interview problems based on real data
1,625 SQL & Python problems across 15 industry datasets — the exact type of data you work with.
Try 250 free problems