Tracking Attention Scores over Time

Using the ‘attention’ dataset from Seaborn, create a line plot showcasing scores over time for each attention group.

Example Output:

You can use the sns.lineplot function, and the attention dataset can be loaded using sns.load_dataset('attention').

import seaborn as sns
import matplotlib.pyplot as plt

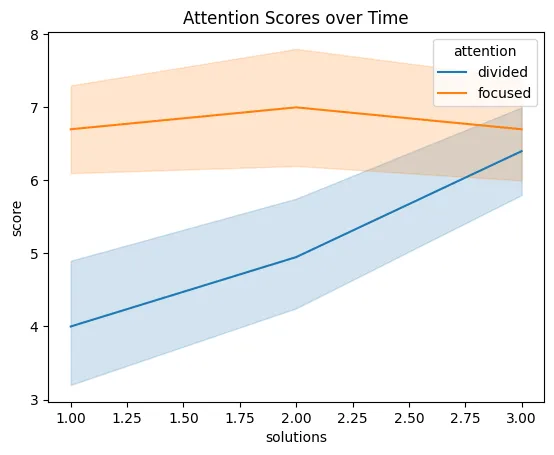
def plot_attention_scores():
    attention_data = sns.load_dataset('attention')
    sns.lineplot(x='solutions', y='score', hue='attention', data=attention_data)
    plt.title('Attention Scores over Time')
    plt.show()

plot_attention_scores()


© Let’s Data Science

LOGIN

Unlock AI & Data Science treasures. Log in!