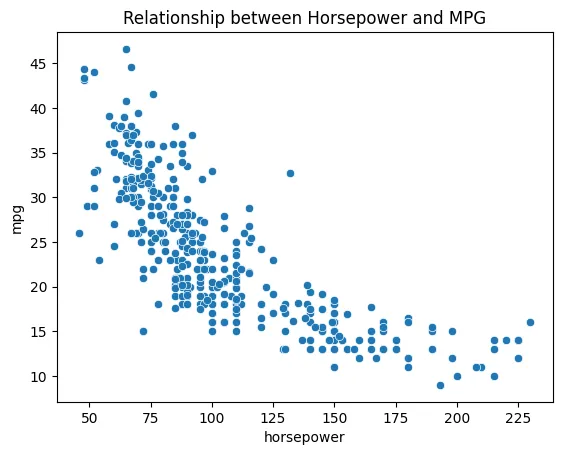
Using the mpg dataset available in Seaborn, plot a scatter plot between ‘horsepower’ and ‘mpg’ columns showcasing the relationship between the two.
Example Output:
You can use the sns.scatterplot function, and the mpg dataset can be loaded using sns.load_dataset('mpg').
import seaborn as sns
import matplotlib.pyplot as plt

def plot_mpg_horsepower():
    mpg_data = sns.load_dataset('mpg')
    sns.scatterplot(x='horsepower', y='mpg', data=mpg_data)
    plt.title('Relationship between Horsepower and MPG')
    plt.show()

plot_mpg_horsepower()
NOTEOwing to browser caching, any code input into the Trinket IDE might carry over across page refreshes or when transitioning between different questions. To commence with a clean slate, either click on the 'Reset Button' found within the IDE's Hamburger icon (☰) menu or resort to using Chrome's Incognito Mode.