Heatmap of Monthly Passengers over Years

Load the ‘flights’ dataset and pivot it to get the monthly number of passengers for each year. Create a heatmap to visualize this data.

Example Output:

You can use the sns.heatmap function, and the flights dataset can be loaded and pivoted using flights_data.pivot("month", "year", "passengers").

import seaborn as sns
import matplotlib.pyplot as plt

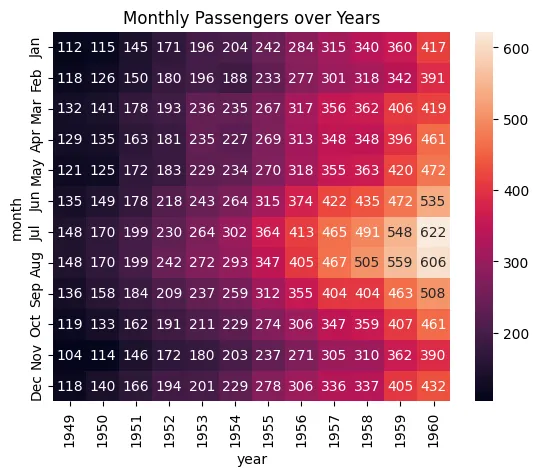
def plot_flights_heatmap():
    flights_data = sns.load_dataset('flights')
    flights_pivot = flights_data.pivot("month", "year", "passengers")
    sns.heatmap(flights_pivot, annot=True, fmt="d")
    plt.title('Monthly Passengers over Years')
    plt.show()

plot_flights_heatmap()


© Let’s Data Science

LOGIN

Unlock AI & Data Science treasures. Log in!