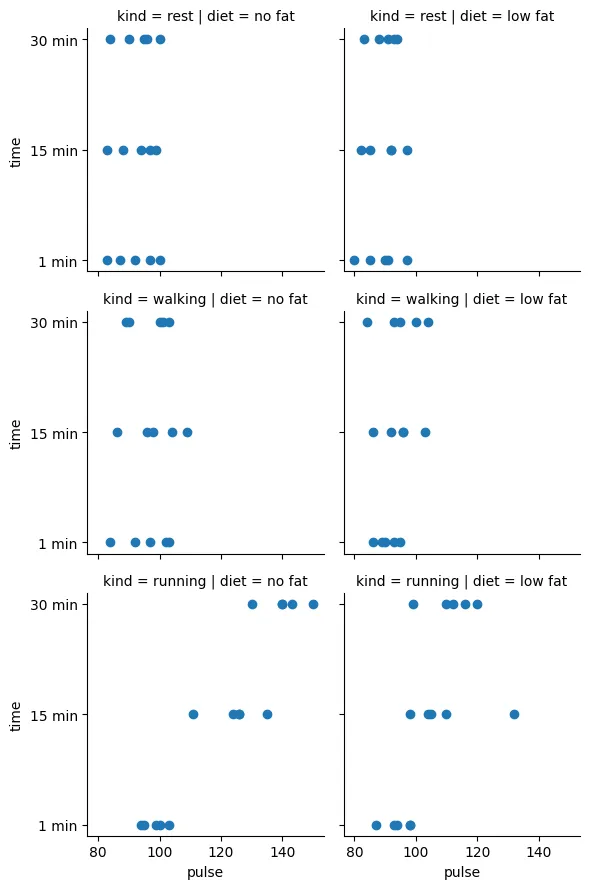
Use the ‘exercise’ dataset. Create a FacetGrid that visualizes the relationship between ‘pulse’ and ‘time’, separating data based on ‘kind’ and ‘diet’.
Example Output:
Use sns.FacetGrid along with the map function, specifying the col and row parameters.
import seaborn as sns
import matplotlib.pyplot as plt

def plot_facetgrid_two_variables():
    exercise_data = sns.load_dataset('exercise')
    g = sns.FacetGrid(exercise_data, col="diet", row="kind")
    g.map(plt.scatter, "pulse", "time")
    plt.show()

plot_facetgrid_two_variables()
NOTEOwing to browser caching, any code input into the Trinket IDE might carry over across page refreshes or when transitioning between different questions. To commence with a clean slate, either click on the 'Reset Button' found within the IDE's Hamburger icon (☰) menu or resort to using Chrome's Incognito Mode.