Clustermap Visualization with Custom Leaf Colors

Load the ‘iris’ dataset, compute a correlation matrix. Create a clustermap and ensure that the leaf colors are customized based on the species.

Example Output:

Use sns.clustermap and play with the row_colors parameter to customize the leaf colors.

import seaborn as sns
import matplotlib.pyplot as plt

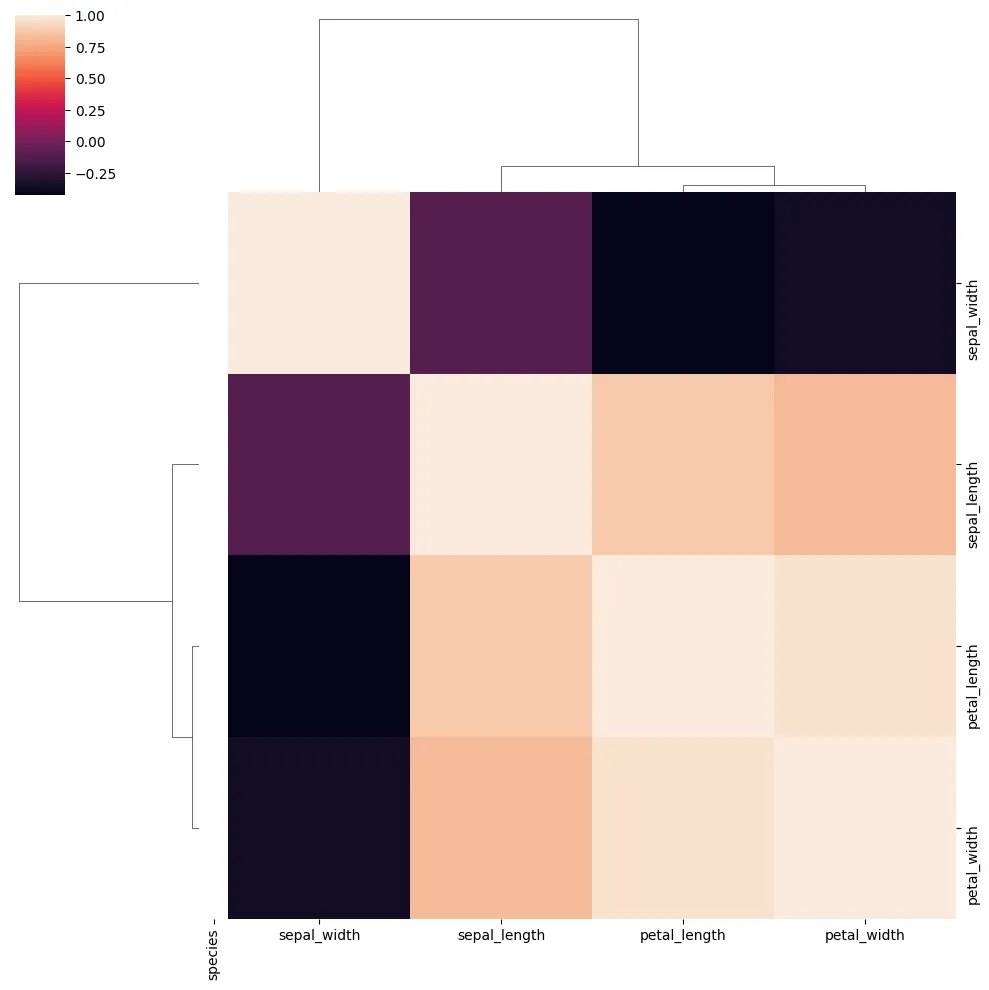
def plot_iris_cluster():
    iris_data = sns.load_dataset('iris')
    species_colors = iris_data['species'].map({
        'setosa': 'red',
        'versicolor': 'blue',
        'virginica': 'green'
    })
    sns.clustermap(iris_data.drop('species', axis=1).corr(), row_colors=species_colors)
    plt.show()

plot_iris_cluster()


© Let’s Data Science

LOGIN

Unlock AI & Data Science treasures. Log in!