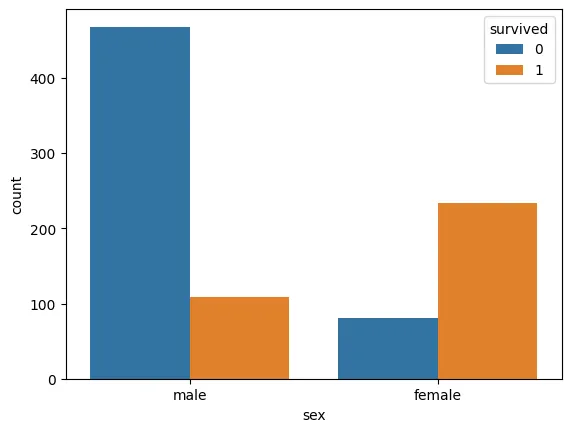
Load the Titanic dataset from seaborn’s built-in dataset collection and plot a bar chart showcasing the number of survivors based on gender.
Example Output:
Utilize seaborn’s countplot method, and you can load the Titanic dataset using sns.load_dataset('titanic').
import seaborn as sns
import matplotlib.pyplot as plt

def plot_titanic_survivors():
    titanic_data = sns.load_dataset('titanic')
    sns.countplot(x='sex', hue='survived', data=titanic_data)
    plt.title('Survivors based on Gender in Titanic')
    plt.show()

plot_titanic_survivors()
NOTEOwing to browser caching, any code input into the Trinket IDE might carry over across page refreshes or when transitioning between different questions. To commence with a clean slate, either click on the 'Reset Button' found within the IDE's Hamburger icon (☰) menu or resort to using Chrome's Incognito Mode.