Proton Adds Private Data Visualizations to Lumo
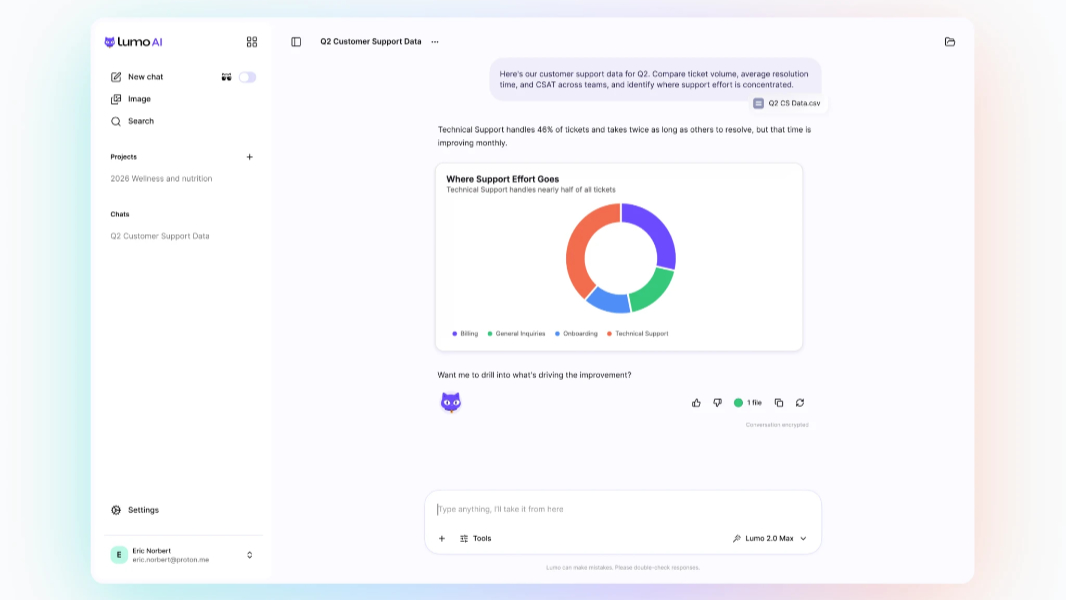
Proton added data visualizations to its Lumo AI assistant on August 3, allowing users to create charts, graphs, and other visuals from spreadsheets, reports, documents, or structured chat data. The feature is available to free users, while Proton says uploaded information and generated visuals remain protected by Lumo's privacy architecture.
Proton added in-chat data visualization to its Lumo AI assistant on August 3. The company says users can upload a spreadsheet or document, paste structured data, or ask a question and receive charts, graphs, metrics, summaries, comparisons, and other custom visuals.
The feature is available to free users. Lumo can generate a visual when asked, or decide that a chart would make an answer easier to understand. Users can then ask follow-up questions, refine the result, or explore another view without starting a new conversation.
From documents to charts
Proton presents the update as a way to review financial reports, sales pipelines, operational metrics, internal research, and other structured information. The product page shows the assistant generating visuals directly inside the conversation rather than sending users to a separate charting application.
That workflow may reduce the friction between a first-pass analysis and a presentable result. It does not, however, replace validation. Proton's announcement does not specify supported file formats, size limits, export options, the model used for analysis, or a method for tracing a generated chart back to individual source values.
Teams evaluating the feature should therefore test whether calculations are reproducible, labels and aggregations are accurate, missing values are handled correctly, and the resulting visual can be audited outside the chat.
Privacy is the product distinction
Proton says Lumo uses no-logs infrastructure and zero-access encryption so only the user can access conversations, uploaded files, and generated visuals. It also says customer data is not used for model training and that Lumo's codebase is open source. These are Proton's product claims; the August 3 announcement does not include an independent security or accuracy assessment of the visualization feature.
For practitioners handling sensitive internal data, the update creates a privacy-focused alternative for lightweight exploration and presentation. The useful next question is not simply whether Lumo can draw a chart, but whether a team can verify the transformation from source data to visual output and fit it within its retention, access-control, and review requirements.
Key Points
- 1Lumo can now create charts, graphs, metrics, summaries, and other visuals from uploaded documents, spreadsheets, pasted data, or chat questions.
- 2The visualization feature is available to free users and supports follow-up refinement inside the same conversation.
- 3Proton says files and visuals remain protected by Lumo's privacy architecture, but the announcement does not provide an independent accuracy or security assessment.
Scoring Rationale
The release adds a practical data-analysis and presentation workflow to a privacy-oriented AI assistant. It is relevant to teams handling sensitive documents, though implementation limits and independent accuracy evidence remain sparse.
Sources
Primary source and supporting public references used for this report.
Practice interview problems based on real data
1,625 SQL & Python problems across 15 industry datasets — the exact type of data you work with.
Try 250 free problems