Etzioni Highlights Global AI Development-Adoption Gap
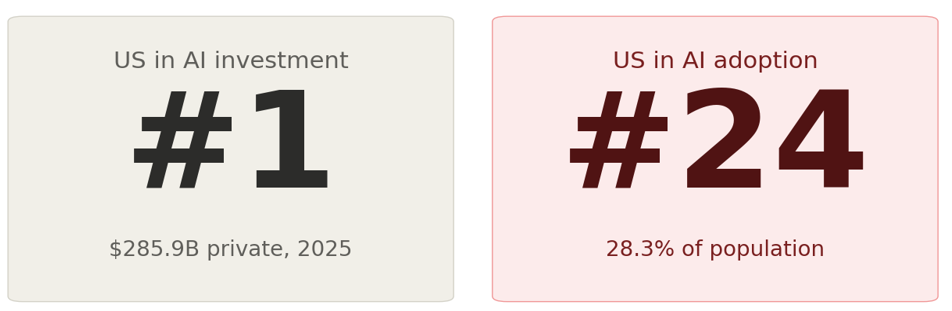
Stanford HAI's 2026 AI Index, a 400-page annual report published April 13, 2026, finds the United States ranks just 24th in generative-AI adoption at 28.3% despite leading global AI investment by a wide margin, while Singapore (61%) and the United Arab Emirates (54%) post the highest adoption among roughly two dozen economies measured. Oren Etzioni, in a June 28 GeekWire column, frames the finding as a growing chasm between countries that build AI and countries that use it: US private AI investment hit $285.9 billion in 2025, 23 times China's total, yet American adoption trails most peer economies. Accounts of the UAE figure differ slightly across coverage (54% in Stanford HAI's own report versus 64% cited in Etzioni's column); this summary follows the report's published number. For practitioners, the divergence suggests national adoption data, not just model benchmarks, should inform deployment and evaluation priorities.
For AI practitioners, the headline finding from Stanford's 2026 AI Index is not about model capability but about where AI actually gets used -- and the gap between the two carries real implications for product strategy, evaluation design, and where the next wave of user feedback data will come from.
What happened
Stanford HAI published the 2026 AI Index on April 13, 2026, a 400-page annual report tracking AI's technical performance, investment, labor-market effects, environmental footprint, public attitudes, and adoption across roughly two dozen economies. The report's cross-country adoption metric, covering the second half of 2025, finds Singapore (61%) and the United Arab Emirates (54%) posting the highest population-level generative-AI adoption, while the United States ranks 24th at 28.3% (Stanford HAI). Oren Etzioni, founding CEO of the Allen Institute for AI, covered the finding in a June 28, 2026 GeekWire column, calling it the report's biggest surprise: the country that builds AI is not the country that uses it most. Etzioni's column states UAE adoption at 64%, ahead of Singapore's 61%; Stanford HAI's own report and other outlets covering the Index, including The Next Web, instead list UAE at 54%, with Singapore first. This summary follows the figures published directly by Stanford HAI, the primary source, and flags the discrepancy rather than resolving it.
Technical context
The adoption gap sits alongside a widening US investment lead -- $285.9 billion in US private AI investment in 2025, 23 times China's $12.4 billion -- and a separate finding that AI talent inflows to the US have dropped 89% since 2017. Adoption correlates strongly with GDP per capita, and the report notes the US sits roughly 13 points below the trend line for its income level, the largest gap among wealthy countries.
For practitioners
Evaluation and rollout planning should treat national adoption levels as an operational signal, not just an academic data point. Lower baseline adoption in a given market affects the volume and representativeness of real-world usage data, the speed of feedback loops, and the case for localized deployment investment. Teams building or evaluating consumer AI products should weigh regional adoption alongside benchmark performance when prioritizing markets.
What to watch
Whether future Index releases show US adoption converging with peer economies as enterprise integrations mature, and whether the report's talent-migration and transparency findings (the Foundation Model Transparency Index average fell from 58 to 40 this year) continue trending in the same direction.
Key Points
- 1Stanford's 2026 AI Index finds the US ranks 24th in generative-AI adoption at 28.3%, behind Singapore (61%) and the UAE, despite a 23x AI investment lead over China.
- 2Coverage of the report conflicts on the UAE's exact adoption figure (54% per Stanford HAI vs 64% per a GeekWire column), a discrepancy this summary flags rather than resolves.
- 3National adoption levels function as an operational signal for practitioners, shaping deployment priority, feedback-loop speed, and evaluation data representativeness across markets.
Scoring Rationale
The Stanford AI Index is the field's most comprehensive annual data source, and the US adoption-rank finding is directly actionable for product, deployment, and evaluation decisions. Score held at 7.0 (notable tier): broad primary-source backing across three independent outlets, tempered by a minor unresolved figure discrepancy (UAE 54% vs 64%) that does not affect the core US-ranking finding.
Sources
Primary source and supporting public references used for this report.
View 4 more sources
- Inside the AI Index: 12 Takeaways from the 2026 Reporthai.stanford.edu
- Etzioni on AI: AI's 'annual physical' surfaces one big surprisegeekwire.com
- Stanford's AI Index finds China has nearly closed the performance gap with the US despite spending 23 times lessthenextweb.com
- 12 Graphs That Explain the State of AI in 2026spectrum.ieee.org
Practice with real Ad Tech data
90 SQL & Python problems · 15 industry datasets
250 free problems · No credit card
See all Ad Tech problems