import seaborn as sns
import matplotlib.pyplot as plt
def dual_theme_visualization():
iris_data = sns.load_dataset('iris')
plt.figure(figsize=(12, 5))
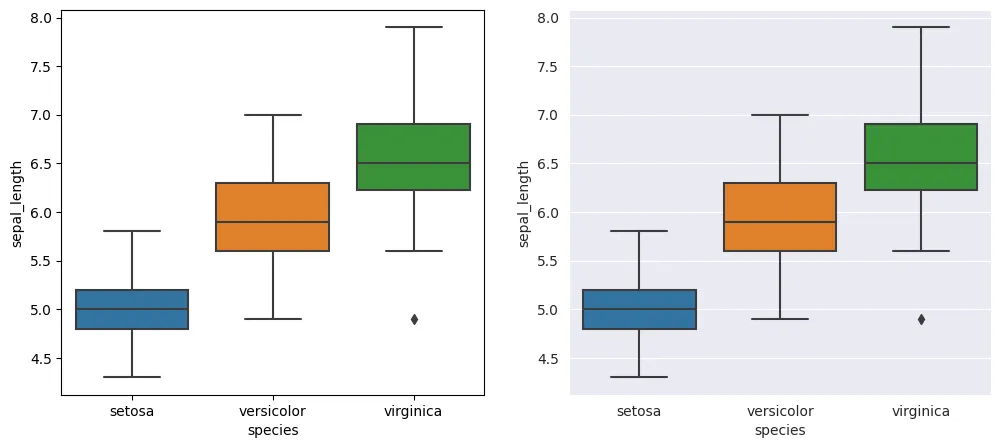
plt.subplot(1, 2, 1)
sns.set_style("darkgrid")
sns.boxplot(x="species", y="sepal_length", data=iris_data)
plt.subplot(1, 2, 2)
sns.set_style("whitegrid")
sns.boxplot(x="species", y="sepal_length", data=iris_data)
plt.show()
dual_theme_visualization()